Where Your $100 Goes The Furthest
The most and least bang for your buck
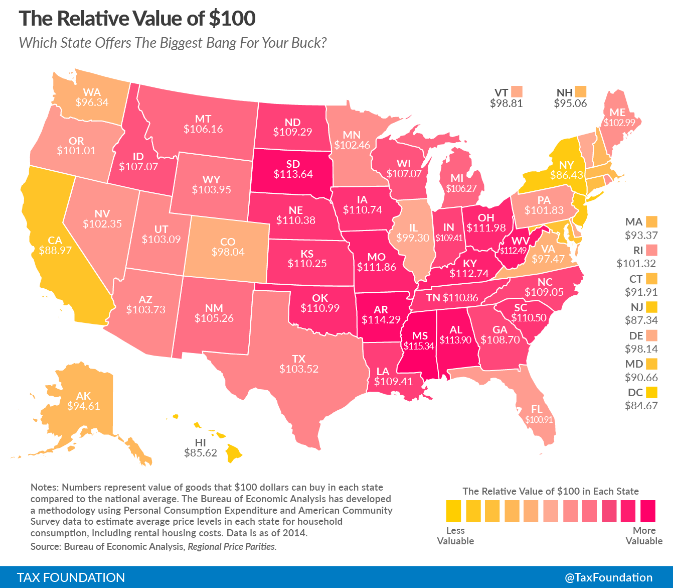
We have a feature that we haven’t trotted out in a while called “My Last Hundred Bucks.” I thought about that while admiring this map and write up from the Tax Foundation that reflects how a fixed amount can vary considerably in its purchasing power, depending on where you are.
The Real Value of $100 in Each State

What can we learn from this?
- Blue states are more expensive places to live than red states. The real value of $100 is one thing in New York ($86.50), DC ($84.67), and Hawaii ($85.62), and another in Mississippi ($115.34), Arkansas ($114.29), and Alabama ($113.90).
Regional price differences are strikingly large; real purchasing power is 36 percent greater in Mississippi than it is in the District of Columbia. In other words, by this measure, if you have $50,000 in after-tax income in Mississippi, you would have to have after-tax earnings of $68,000 in the District of Columbia just to afford the same overall standard of living.
- Your dollars go further off of the coasts. The original 13 colonies especially are inhuman. Let’s blame the Puritans, or else the Pilgrims, or maybe both. Your dollars go a bit further in Vermont than in New Hampshire, which is the opposite of what I would have guessed, since the pop culture picture of Vermont is of a place full of deep-pocketed yuppie transplants while New Hampshire seems to overflow with gritty “Don’t Tread on Me” authenticity.
- The landlocked state that most resembles a coastal state in terms of expense is Colorado: $98.04, in line with Virginia at $97.47. Meanwhile, the coastal state that most resembles a landlocked state is South Carolina at $110.50.
- Places that charge more generally also pay more. Not all, though. “Some states, like North Dakota, have high incomes without high prices.” North Dakota’s an uncommonly good value, in other words. I got two words for you, y’all: Far-go.
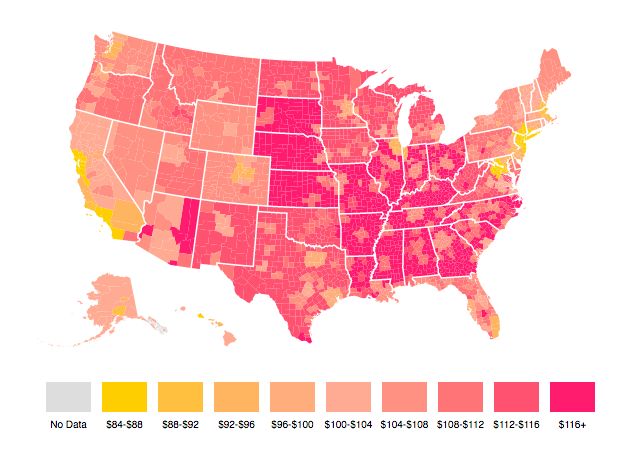
- What’s that you say? These numbers are of limited utility because cities differ so much from rural areas and they skew the averages? The Tax Foundation is On It. Check out their county-by-county map. There’s a lot less yellow there. It’s clear that one or two pricey metro areas can skew an entire state. It’s also clear that New Jersey, even without a single decent city, is stupidly expensive.

Some cities — particularly those with relaxed zoning restrictions and a lot of flat land to build on — are cheaper than others. In particular, Cincinnati ($111.36), St. Louis ($110.50), and Atlanta ($104.60) manage to stand out as less expensive than average, despite having large populations and huge corporate headquarters for firms like Procter & Gamble, Anheuser-Busch, and Coca-Cola.
And all non-urban areas aren’t created equal, either.
price differences do persist across states, even in non-metropolitan areas. That $100 still doesn’t go nearly as far in rural California ($103.73) as it does in rural Texas ($113.25). It doesn’t even go as far as it does in San Antonio ($105.93).
Note: wanna submit a “My Last Hundred Bucks”? Get at me: ester at the billfold.com. Make sure to indicate whether its purchasing power was more along the lines of Little Rock or Cos Cob.
Support The Billfold
The Billfold continues to exist thanks to support from our readers. Help us continue to do our work by making a monthly pledge on Patreon or a one-time-only contribution through PayPal.
Comments